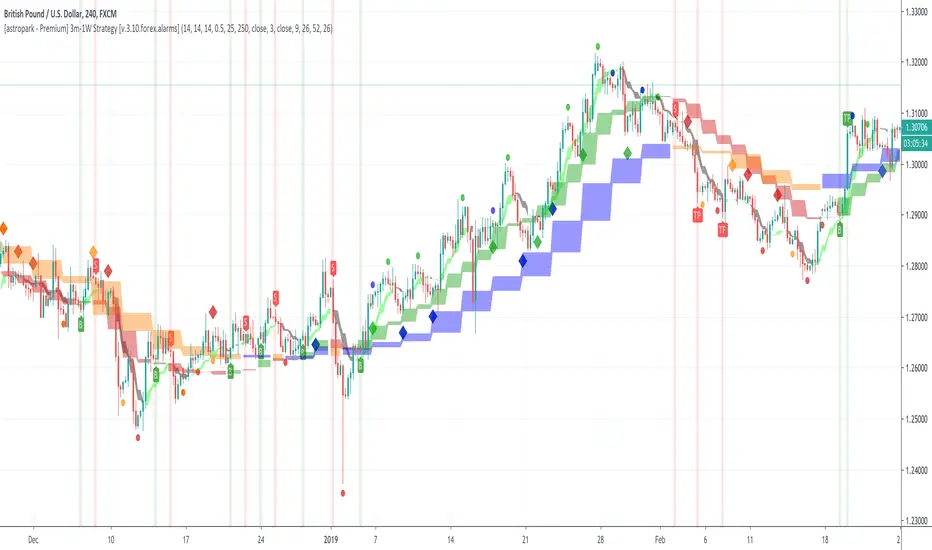
[astropark - Premium] Long-Short Strategy V3-FOREX [Alarms]This indicator is not holy grail , but it is an amazing trend finder and works nicely between 3m and 1W timeframes on FOREX :)))
With this indicator you can enjoy its trading signal and set the alarms you need!
In fact, if you want to set alerts on both buy, sell, take profit and stop-loss signals you must use this not-strategy indicator version!
This indicator is the non-strategy version of this one:
HOW TO USE THIS INDICATOR
Buy/Long when you see a green "B" label on the chart at best price you can, you have time till next candle's open price , trying to buy as low as possible near the green cloud or below it. Green cloud acts like a moving support for price, so use it for more buys/longs. The bigger the cloud, the stronger the bull-trend and so the support.
Sell/Short when you see a red "S" label on the chart at best price you can, you have time till next candle's open price , trying to sell as high as possible near the red cloud or over it. Red cloud acts like a moving resistance for price, so use it for more sells/shorts. The bigger the cloud, the stronger the bear-trend and so the resistance.
This indicator suggests some TP (Take Profit) for both longs (in green color) and shorts (in red color): you can start (at least partially!) closing the current trade (eventually you start new longs/shorts at cloud touch if you are a bold trader!).
Keep in mind that the lower the timeframe you work on, the easier is the trend to change rapidly, so always set a -2% / -5% stop-loss on trades and follow the trend with a nice trailing stop strategy.
Of course, as said at the beginning, this indicator suggests some TPs (Take Profits) for both longs (in green color) and shorts (in red color) operations: when you see a TP, you can start (at least partially!) taking profits over the current trade and move stop-loss higher (at least at break-even).
This is a premium indicator , so send me a private message in order to get access to this script.
Do you like my free scripts? Offer me a coffee, a beer, a pizza or whatever :)
BTC jar: 1K5kuYQPEqoNo6GRmJbHWMPmqwKM5S3oRR
ETH jar: 0x091b541a6dd6fe08c4e7bd909baafb2fce9b975e
LTC jar: LSVoAChsZrVsvbNyUfdpxtFpDAUSaUTUig
XRP jar: (XRP deposit tag) 103997763 (XRP deposit address) rEb8TK3gBgk5auZkwc6sHnwrGVJH8DuaLh
PS: Do you need a customization or do you need a dev who implements your strategy? send me a private message ;-)
In den Scripts nach "take profit" suchen
Darvas Box/Turtle Way Breakouts v.2 by ZekisFor those who never heard about these two huge strategies:
* * * Darvas Box Strategy - www.netpicks.com
* * * Turtle Way Strategy - www.investopedia.com
In very short terms, both strategies are based on breakouts, probably the easiest way to trade (with proper education, obviously)
I created this indicator based on highs and lows, which will create support and resistance line, which will create a channel/box.
There is the possibility to :
- change channel/box size
- ride it till it will enter again into the channel/box
- set TPs and SL targets
- set alerts for Long, Short, Close when price enter into the channel, SL
- enable or disable 2 TP targets
- enable or disable 1 SL
- enable or disable middle line
Rules are simple:
1. Go Long when price breaks the upper line
2. Go Short when price breaks the lower line
3. Exit Long/Short when price enter into the channel/box
4. Stop Loss are added for safety
5. Added 2 layers for Take Profits
6. Added middle line that can act as Stop Loss
Legend:
1. White line - channel/box
2. Upper white line followed by green line - price cracked the channel/box - Go Long
3. Lower white line followed by red line - price cracked the channel/box - Go Short
4. Red zone - Stop Loss zone
5. Dotted red line - Stop Loss line
6. Dark green zone - first Take Profit zone
7. First dotted dark green line - first Take Profit target
8. First dotted dark green line followed by dotted lime line - price touched first Take Profit
9. Bright green zone - second Take Profit zone
10. Second dotted dark green line - second Take Profit target
11. Second dotted dark green line followed by dotted lime line - price touched second Take Profit
12. Dotted gray line - channel/box middle line
*** Don't use any indicator without knowing whatyou are doing, there is no such a magic lottery winning ticket
Trade safe!
Enjoy!
@Zekis

Support And Resistance @Mr_HokageDi sini saya menggunakan indikator MA untuk Menjadi support dan resistance Dgn indikator ini Kita bisa melakukan eksekusi After break misalkan Garis merah mulai berbalik arah dari turun dan mulai ke atas maka siapkan buy Dan jika Harga melewati garis merah lakukan sell Lalu kita tunggu sampai harga ke garis hijau atau tidak jika harga ke garis hijau dan tembus lakukan Buy Target profit 5-30% saran saya di jual bertahap saja dan jika ternyata tidak sampai 5-30% lakukan sell ketika harga tiba tiba memotong ke bawah garis hijau Lalu bagaimana jika mau entry sell misalkan kalian main di forex/bitmex untuk long Sama seperti tadi cara entry Buy/Long nya dan jika Short/Sell Tunggu harga memotong garis merah ke bawah lalu entry sell dan jika memotong ke atas entry buy
Profit Memotong Garis merah lebih kecil di bandingkan Memotong Garis Hijau
Saran TF 1H-1D
take profit
garis merah
1-20% TF 1H-1D
garis Hijau
5-50% TF 1-1D
Semakin Besar TF semakin besar juga profitnya jangan menggunakan TF 1H tapi mau profit 50% itu terlalu jauh jika kurang jelas silahkan di kembangkan sendiri ilmunya

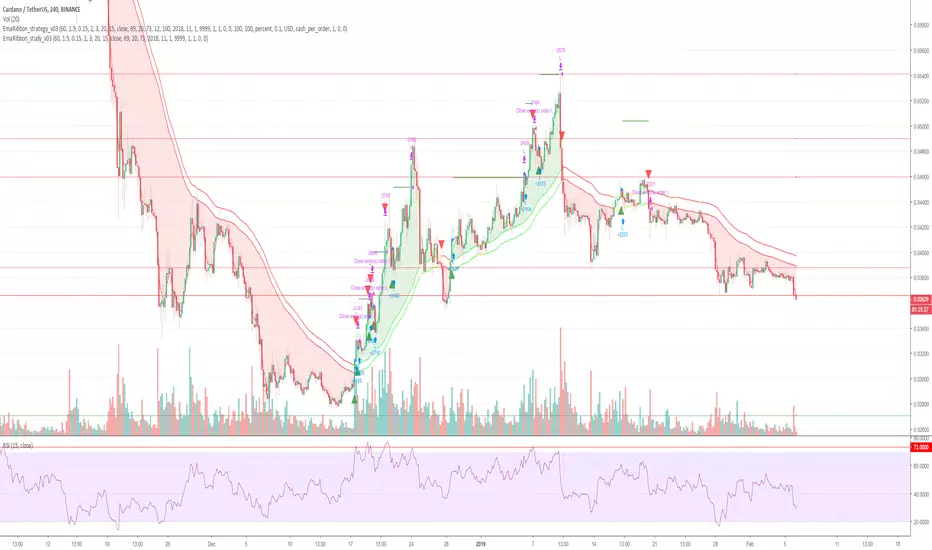
Cryptocurrency trend following EMA Ribbon LONG only studyThis strategy is based on EMA Ribbon and uses multiple indicators to find optimal time to enter/exit the trade and filter out false signals. The script with default setting is developed mainly for trading altcoins/stable coin pair such as ADA(USDT etc on 4h timeframe but it can be applied to any pair/any timeframe with some settings adjustments.
For plot on chart features make sure that you have both study and strategy scripts on chart with same settings.
Strategy settings description:
1. Signal EMA Length - Value for exponencial moving average (slowest from EMA Ribbon)
1a. Buy price toleration (%) - Price deviation for filtering bounces of EMA - price must close defined percents above EMA to open long trade
1b. Sell price toleration (%) - Price deviation for filtering bounces of EMA - price must close defined percents bellow EMA to close long trade
1c. EMA deelay - EMA id delayed by defined bars for smoothening
2. Filter by Fast EMA - Strategy filters signals to prevent buy while coin is dropping
2a. Fast EMA Length - Value for fast exponencial moving average
3. Filter by SMA - Strategy filters signals to confirm trend change
3a. SMA Length - Value for simple moving average
4. Filter by RSI - Strategy filters signals to prevent buing/selling overbought/oversold coins
4a. RSI Length - Length of RSI identificator
4b. RSI Source candle - What price of candle is used for RSI calculation (open, close, high, low)
4c. RSI Long condition - When buy, RSI indicator must be below this value to prevent of buying already overbought coin
4d. RSI Short condition - When sell, RSI indicator must be above this value to prevent of selling already oversold coin
5. RSI Close Trade Condition - Strategy sell coin once RSI reach defined value
5a. RSI close trade condition - Sell once RSI indicator acquires defined value
6. Close trade by Take Profit or Stop Loss Condition (STRATEGY ONLY) - Strategy sell coin once defined take profit / stoploss level is reached
6a. Take Profit (%) - Take profit value in percent
6b. Stop Loss (%) - Stop loss value in percent
6c. Plot targets on chart - defined targets will be plotted as lines on chart
7. Date range from
7a From Year - To run strategy in interval
7b From Month - To run strategy in interval
7c From Day - To run strategy in interval
8. Date range to
8a To Year - To run strategy in interval
8b To Month - To run strategy in interval
8c To Day - To run strategy in interval
9. Wait to confirm the signal
9a Wait candless to buy - strategy will wait defined candless to confirm the signal before buy
9b Wait candless to sell - strategy will wait defined candless to confirm the signal before sell
10. Plotting on chart (STUDY ONLY)
10a Plot signal line channel with bows on chart
10b Plot simple moving average on chart
10c Plot EMA Ribbon on chart
10d Plot recent support and resistance levels on chart
11. Show Every signal (STUDY ONLY) - Unchecked shows only first signal based on strategy. But if you use take profit/stoploss settings within your bot, you might want to rebuy on next signal. Checked shows signal on each candle.
Throw on chart also buld-in RSI indicator and set the same as strategy
Notice that there might be false signals, especially when the coin is not trending or is strongly manipulated. Overall strategy is profitable though. You just take some minor loses and wont miss the big move.
You may also consider to compare buy&hold return vs profit from trading this strategy. In downtrend as we have seen recently, profit may not be as high as you expect but it is still much better than just hold and hope.
You can use the strategy script for fine tunning settings and find best settings for yourself.
Study script helps you to automate trading with use of alerts perharps with 3commas bot or even trade manually based on email/sms notification setted by tradingview
Notice that study script does not handle takeprofit/stoploss order. That is why sell arrows could be plotted by study script later than strategy script. To rebuy after takeprofit/stop-loss use "11. Show Every signal (STUDY ONLY)" setting
Make sure that you keep same settings for strategy and study scripts.
If you need any help with settings do not hesitate to ask. I would also appriciate any feedback and ideas how to improve this script.
Here is backtest result from 1. Nov 2018 using constant 100USD Buy ammount:
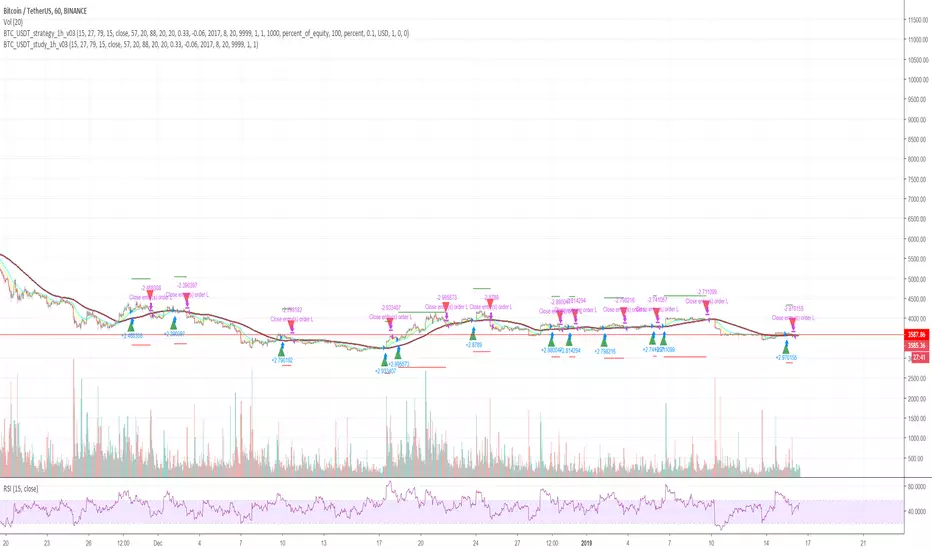
Cryptocurrency trend following LONG only studyThis strategy uses multiple indicators to find optimal time to enter/exit the trade. The default setting is mainly for trading bitcoin/stable coin pair such as USDT etc on 1h timeframe but it can be applied to any pair/any timeframe with some settings adjustments.
Strategy settings description:
ID Name Descrption
1 FastMA - Value for fast exponencial moving average
2 SlowEMA - Value for slow exponencial moving average
3 SMA - Value for simple moving average
4 RSI Length - Length of RSI identificator
5 RSI Source candle - What price of candle is used for RSI calculation (open, close, high, low)
6 RSI Long condition - When buy, RSI indicator must be below this value to prevent of buying already overbought coin
7 RSI Short condition - When sell, RSI indicator must be above this value to prevent of selling already oversold coin
8 RSI close trade condition - Sell once RSI indicator acquires defined value
9 Take Profit (%) - Take profit value in percent
10 Stop Loss (%) - Stop loss value in percent
11 Long price toleration (%) - Price deviation for filtering bounces of simple moving average - price must close defined percents above SMA to open long trade
12 Short price toleration (%) - Price deviation for filtering bounces of simple moving average - price must close defined percents bellow SMA to close long trade
13 From Year - To run strategy in interval
14 From Month - To run strategy in interval
15 From Day - To run strategy in interval
16 To Year - To run strategy in interval
17 To Month - To run strategy in interval
18 To Day - To run strategy in interval
19 Show every signal? - (Study only) Unchecked shows only first signal based on strategy. But if you use take profit/stoploss settings within your bot, you might want to rebuy on next signal. Checked shows signal on each candle.
Notice that there are also false signals, especially when the coin is not trending or is strongly manipulated. Overall strategy is profitable though. You just take some minor loses and wont miss the big move.
You may also consider to compare buy&hold return vs profit from trading this strategy. In downtrend as we have seen recently, profit may not be as high as you expect but it is still much better than just hold and hope.
You can use the strategy script for fine tunning settings and find best settings for yourself
Study script helps you to automate trading with use of alerts perharps with 3commas bot or even trade manually based on email/sms notification setted by tradingview
Make sure that you keep same settings for strategy and study scripts.
If you need any help with settings do not hesitate to ask. I would also appriciate any feedback and ideas how to improve this script.
Here is backtest result from 23.08.2017:
makeTPSo this model try to use the the take profit issue as important
the model is based on the early model that I put in last publication , the problem is that the fire point of the buy and sell has a delay and shoot some bars after (its not repaint but a bug due to TV code) . but once it stay it will calculate correctly the take profits . so I add take profit 1 and take profit 2 to the script . and since take profit 1 is correct without delay I add option to use it as buy again or short again . you can the older entry point which is H= high or L =low as your initial buy point but be aware that it sometime shoot too late since the problem in TV script to transfer the price correctly .or to enter to buy again option which is based on take profit 1 . the H and L are correctly detecting most of the time the Highs and the lows so by going on the trend them you can use the TP which are by % to max out your gains .. this is the theory behind this model
see here on amazon the concept

Bitcoin Pine Script - Tom Hall StrategyThe Bitcoin script is a combination of crucial indicators that align across multiple timeframes.
How To Apply The Script:
Apply the script to your chart by clicking the ( Add to Favourite Scripts )\u2028
BSO = Buy Stop Order
The BSO symbol will appear once a valid trade opportunity presents itself.\u2028
Once the BSO candle closes it will provide you the parameters for a Buy Stop Order.
Orange Horizontal Line = Buy Stop Order Entry
Green Horizontal Line = Take Profit
Red Horizontal Line = Stop Loss
Key Information:
(1) The BSO is valid for a period of 24 hours, should price not trigger a live position the BSO must be cancelled.
(2) The horizontal lines that track price action are only relevant once a BSO candle has closed.
Alert System:
The alert system allows you to receive SMS / Email notifications in addition to a screen notification providing you information a BSO is required.
How To Apply The Alert System:
(1) Windows Press ( ALT + A ) / MacBook Press ( Option + A )
(2) Adjust the condition section from BTCUSD to Tom Hall Strategy\u2028
(3) Two crucial boxes will appear, The Lowest EMA and Buy Stop Order.
(4) Click create, this will allow you to receive Email / SMS notifications once a valid trade opportunity is available.\u2028
Profitable Edge:
Data From: 31st March 2013
Positions Executed: 76
Profitable Trades: 52
Losing Traders: 24\u2028
Risk / Reward: 1:1
Strike Rate / Profitable Edge: 68.43%
2013: 80% Profitable ( 10 Positions )
2014: 60% Profitable ( 5 Positions )
2015: 75% Profitable ( 16 Positions )
2016: 45% Profitable ( 20 Positions )
2017: 82.61% Profitable ( 23 Positions )
Style / Inputs:
All visible parameters can be adjusted to individual taste and preference.

MACs EasyMoney - Advanced BOT VersionHi All,
Introducing my next development - The Advanced-BOT Version , with major code updates :)
Symbols in Chart:
1) "S" --> refers to Sell/Short
2) "L" --> refers to Buy/Long
3) "Lime color arrow down" symbol --> refers to take profits location from the last recent "L" signal.
4) "Aqua color arrow up" symbol --> refers to take profits location from the last recent "S" signal.
It has 6 Alert Systems:
1) Enter Buy
2) Enter Sell
3) Exit Sell
4) Exit Buy
5) Close Sell
6) Close Buy
Difference between Exit and Close options are,
--> "Exit" options --> will stop the order at safer position - in case if market flips suddenly.
--> "Close" options --> will close the orders at local Top/Bottom to come out with very good profits.
Happy Trading :)
Thanks,
Mac

NGRN MACD-X & RSI v5MACD-X, RSI & Volume Indicator & Alerts Study - Version 5
Overview
This study and it's associated strategy were modeled after the famous Philakone described algorithms on his now defunct instructional video series.
This indicator allows for full customisation of parameters and interaction between three indicators that allow users to shape their trading methods to their desired goals.
This associated strategy also allows users to backtest the study alerts script and find the best settings towards that end.
MACD + RSI + VOLUME - are of the most powerful and widely usded indicators, MACD/Histogram crosses, coupled with RSI & Volume increases/decreases will detects areas of deeply oversold / overbought and buys/sells on the reversal
Features
Full customisation - All parameters are open for customising to allow the trader to build their own strategy and adapt from market to market.
Clean/Simple UI - Facilitating ease of use.
Enable Buying OR Selling, - or have them both active at the same time.
Toggle off and on ALTERNATING Buy and Sell feature (pyramiding) - to allow for consecutive DCA style buys or SCALING out of an entry (partial sell).
Customizable Stop-Loss plot - to enable users to create a STOP-LOSS alert option or other alert(s) based on the plot location. See settings screenshot.
Toggle Auto Stop-Loss sell option - to enable users choose whether or not to automatically issue a sell signal when close crosses stop loss plot, or choose to toggle off if not profitable.
Customizable Take-Profit plot - to enable users to create a TAKE-PROFIT alert option or other alert(s) based on the plot location.
Study and associated Strategy - to use the TradingView ‘Strategy Tester’ back-testing features to find the best alert settings for specific coins in bear, bull and sideways markets.
Changes Version 5
Added STOP-LOSS time-out period where users may specify a duration of trading pause time after a stop-loss has been triggered. A value of zero disables the feature. Time out start is indicated by a red flag icon and resumption is indicated with a green flag.
Settings
SCREENSHOT LINKS:
BUY SETTINGS: prntscr.com
SELL SETTINGS: prntscr.com
Access
For a 4 DAYS TRAIL, sign up as an Explorer subscriber @ Patreon page: www.patreon.com
Full Access is 0.25 ETH , one time fee for LIFETIME access to the STUDY indicator, STRATEGY and future updates as well as support and SETTINGS for various markets on the Binance Exchange.
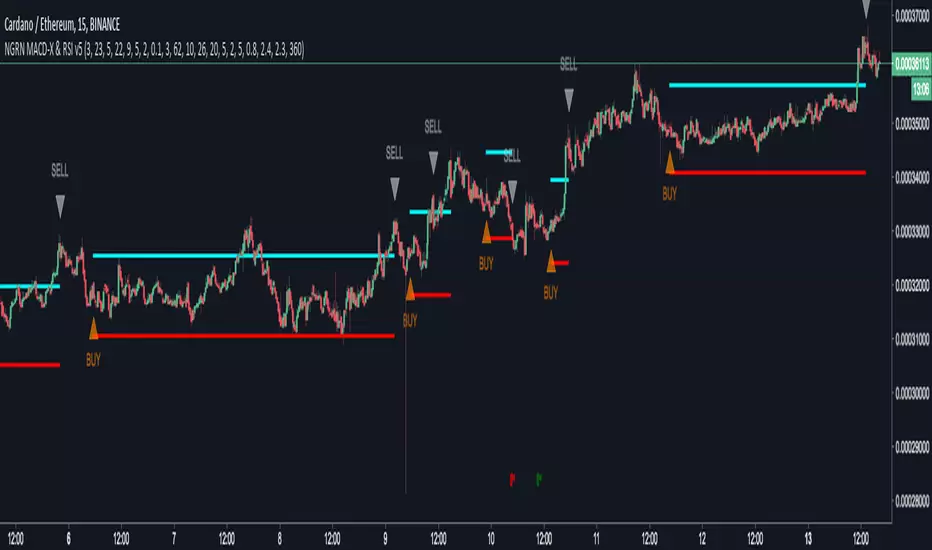
Rocket number 1Rocket number 1
Class : oscillator/trend
Trading type : intraday
Time frame : 15 min
Purpose : reverse points identification
Level of aggressiveness : aggressive
Indicator « Rocket number 1 » generates synthetic support/resistance lines, using the Gaussian distribution for 2 exponentially weighted moving averages, corrected on multiplied standard deviations of these averages.
Simply put, indicator calculates support/resistance zones, generates trading signals and provides information about stop-loss and take-profit values. That is, gives everything a trader needs for professional activity.
Despite the fact that indicator « Rocket number 1» is of oscillatory nature, its algorithm provides preliminary filtration of the oscillatory signals. Only those which are in the local tendency are allowed. That means in case of local downward tendency all the oscillatory “buy” signals will be forbidden and will not be displayed on the chart. This will allow to increase overall quality of the indicator and to increase the % of successful trades,
Structure of the indicator
Indicator consists of 2 blocks:
- oscillatory block – responsible for reverse points identification;
- trend block – is used for the filtration purposes.
The main visual elements of the indicator are:
- Red zone – sell zone. Entering this zone means local price overbought and shows that price reached the resistance line. From this place the likelihood of up-down price reverse is maximum;
- Blue zone – buy zone. Entering this zone means local price oversold and shows that price reached the support line. From this place the likelihood of price down-up reverse is maximum;
- Green line – middle line of the price channel. Used to define take-profits for the most aggressive trades;
- Orange line – local trend line. Only signals in direction of this line are allowed;
- Maroon line (the highest line) – displays stop-loss values for the short positions (sells);
- Dark blue line (the lowest line) – displays stop-loss values for the long positions (buys);
Only permitted signals are displayed on the chart in form of triangles with according color: blue triangles for the “buy” signals and red – for the “sell” ones.
Input parameters of the indicator
To set up the indicator a number of input parameters are used:
- EMA 1 period – period of the fast average (by default 8);
- EMA 2 period - period of the slow average (by default 13);
- TrendLine period – period used to detect trend (by default 55);
- Number of deviations – multiplier of the standard deviations number. This parameter is responsible for the level of aggressiveness of the indicator. The lower the parameter is the more aggressive indicator is, but this can reduce the quality of the signals.
Rules of trading
Appearance of a blue triangle on the chart is a “buy” signal, a red one – is a signal for “sell”. Take-profits are set near the green line (case of fast trades of partial profit fixation) or to the nearest blue zone (case of “sell” trades) and nearest red zone (case of “buy” trades)
For short positions (“sell”) stop-loss is set near the maroon line. For the long positions (“buy”) stop-loss is set near the dark blue line.

Angelou's RSI
Hello and welcome, this is AngelouHD and this is my RSI oscillator based on RSI 14 (classic and most used by all traders).
I was studying RSI and found out that this awesome tool is very helpful, so I did more research and added some features which includes:
1 LONG signal which is that bold green pattern on the RSI (white).
2 SHORT signal which is that bold green pattern on the RSI (white).
3 Supports and resistances in most common areas such: 100, 90, 80, 70, 66, 50, 34, 30, 20, 10 and 0.
To consider:
* 100, 90, 80, 70 and 66 RSI (most of the times, my studies showed that most traders are likely to TAKE PROFITS and SELL/GO SHORT.
I found out that 100 RSI is a must, must SELL and TAKE PROFITS (overbought).
* 50 RSI is also good zone for ENTRY and BUY/GO LONG only in very bullish market, you got to be very carefull on this, so first study the market conditions: BTC bullish, book orders looking bullish, coins @ good support / resistance lines, etc. If none of the previous conditions, then don't trade and wait for lower RSI levels.
* 34, 30, 20, 10 and 0 RSI most of the times, my studies showed that most traders are likely to ENTRY and BUY/GO LONG.
I found out that 0 RSI is a must, must BUY and TAKE ACTION (oversold).
All this is just my studies and my opinion, not a finantial advice. Not always will work the way I'm explaining since this Crypto World is full of manipulation, so please take note.
LAST THING: Search on youtube and do your own research about "RSI divergences" and you will understand why sometimes even if RSI is high (overbought), let's say 70 RSI... your coin continue to go up and up and then RSI goes below 60 RSI and that coin continues to go upbullish.
And viceversa sometimes you see RSI is very low (oversold) et's say 20 RSI... your coin continue to go down and down and then RSI goes above 30 RSI and that coin continues to go bearish.
I wish you the best and I hope you take advantage, stay profitable, be careful but take action, no fear. Jesus Christ bless you all!

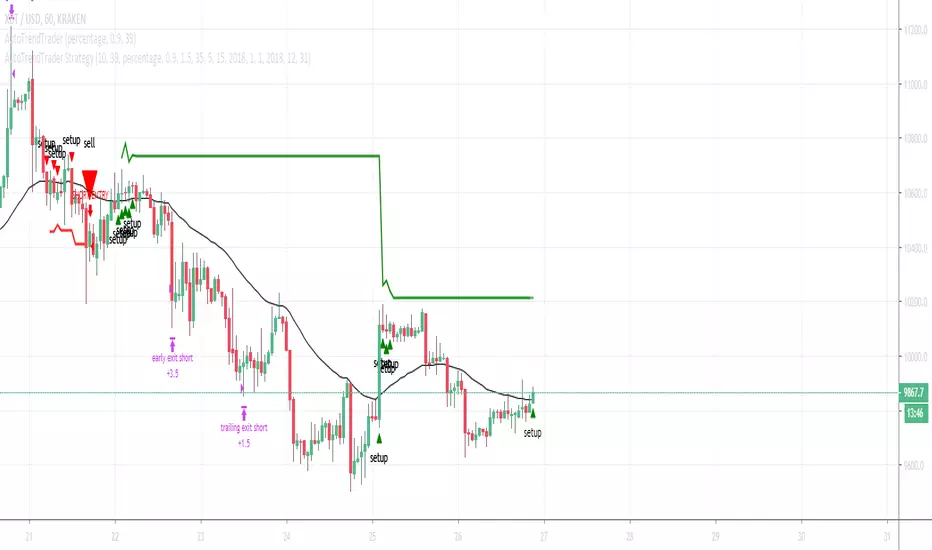
AutoTrendTrader"The Trend is your Friend" is a popular quote and Day-Traders, as well as long-term Investors, build their Strategies on top of this Mantra.
Leverage this Principle by using AutoTrendTrader to ride the Trend and let your Profits run!
Get Email-Alerts with your customized buy and sell signals, or use autoview to trigger and exit the trades.
Features:
Reliable Detection of Up- and Downtrends - this will enable you to enter strong Trends at the right time
Partial Profit Taking - Configure your perfect Mix of taking profits early vs. letting profits run
Reversing Signals - Limit your Draw-Down
Proprietary Algorithms combined with multiple Confirmations via other Technical Indicators
What's included:
AutoTrendTrader Study (generate Signals)
AutoTrendTrader Strategy (backtest your Settings)
This Study was built to be used with autoview . It generates Alerts that can be used as Entry-Signals. Taking Profits will be configured via autoview. You can configure partial profit taking via autoview and exit Positions via the reverse Signal.
But of course this Study can be used to generate Entry-Signals for any Asset and then exit Positions based on your own technical Analysis.
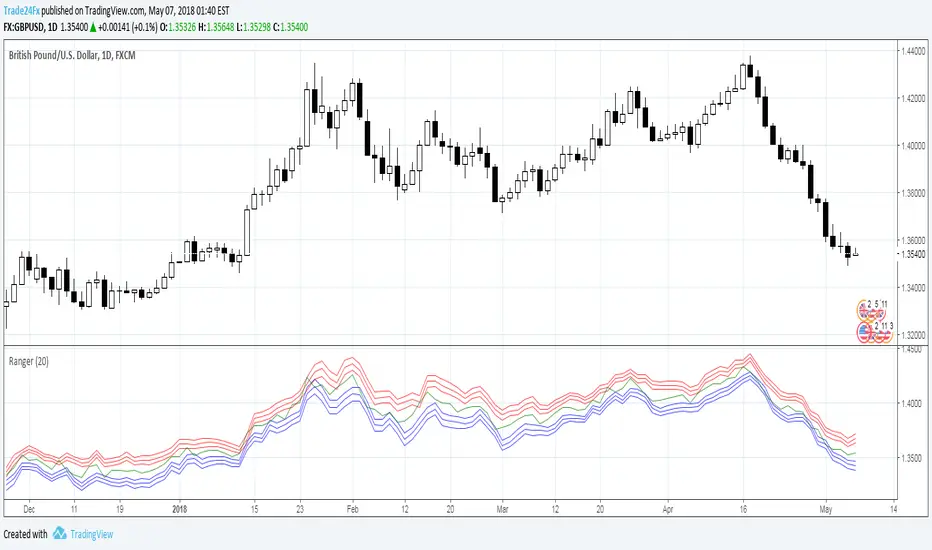
RangerIndicator Ranger
Class : oscillator
Type of trading : intraday
Period : daily
Description
A lot of technical indicators are based on quite doubtful assumptions and unconfirmed patterns. One more typical drawback is absence of signals from indicators in form of absolute price values (this also concerns stop-loss and take-profit parameters). As the result it is hard to determine the exact entry and exit points for the trade. This is very important both for the beginners and experienced traders.
Developing Ranger we were trying to solve this problem and to create extremely simple and at the same scientifically based indicator.
Ranger is based on statistical analysis of the data and provides information about possible maximum/minimum values of the day (just right after the day has started) with certain probabilities. So called synthetic support and resistance levels.
For example at 00:00 am EURUSD open price is 1.1350 Ranger will generate a number of price values which will indicate possible minimum/maximum of the day. It can be something like 1.1440 (high of the day with probability 75%) and 1.1260 (low of the day with probability 75%). Current version of the indicator can generate up to 3 high/low values with probabilities 70%, 95% and 99%. By probability we mean chance that the price will not go above/below generated high/low value.
What does this information give to the trader? Actually, a lot. First of all, trading signals. For example, if during a day the price approaches the upper (lower) mark, it can be concluded that it will not go higher (lower) prescribed mark today with already known probability. So, you can open a position opposite to the current movement, knowing in advance that it will be profitable with certain probability. For the full information about signals from Ranger see the “Trading signals” section.
Structure of the Indicator Ranger
1. Three blue lines – synthetic support lines. They describe 3 different buy zones with certain probabilities of success:
- First blue line (Buy zone #1) - the price today will not fall below this mark with a probability of 68%;
- Second blue line (Buy zone #2 )- the price today will not fall below this mark with a probability of 95%;
- Third blue line (Buy zone #3) - the price today will not fall below this mark with a probability of 99%.
2. Three red lines – synthetic resistance lines. They describe 3 different sell zones with certain probabilities of success:
- First red line (Sell zone #1) - the price today will not rise above this mark with a probability of 68%;
- Second red line (Sell zone #2) - the price today will not rise above this mark with a probability of 95%;
- Third red line (Sell zone #3) - the price today will not rise above this mark with a probability of 99%.
3. Green line – shows current price. When it gets close to the red/blue line sell/buy signals are generated.
Trading rules
General rules are as follows: buy at the blue lines, sell at the red lines.
Take-profits for sells are set at the nearest blue line, for buys – at the nearest red line. Stop-losses for sells are set above the last red line, for buys – below the last blue line.
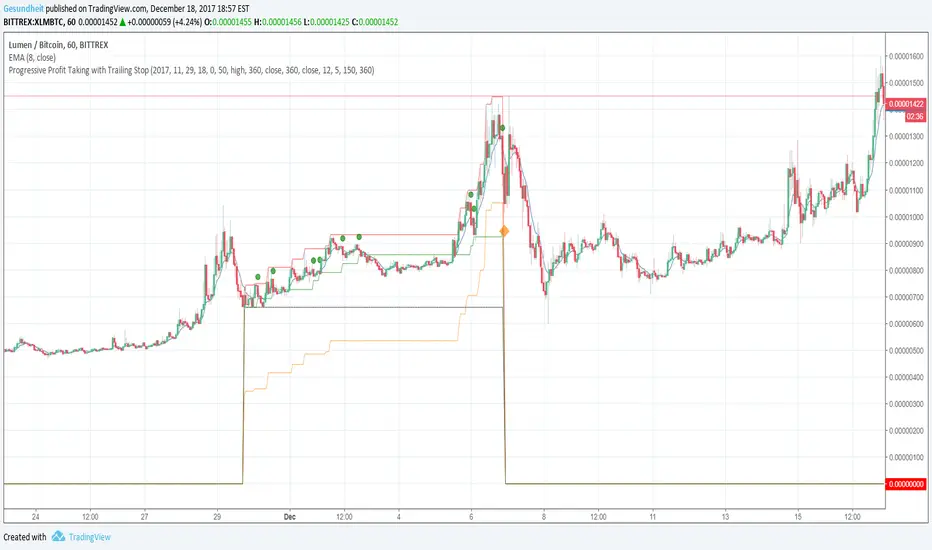
Progressive Profit Taking with Trailing StopThis is version 2 of
Special features:
Added partial profit taking as price rises. Profit taking is triggered by price crossing an EMA.
After profit taking, price has to rise by a user-specified percent before taking profits again.
Also includes condition for fully closing position after meeting specified profit target.
To incorporate into your algo, turn the plotshape functions into alertcondition.
Elder's Market Thermometer [LazyBear]Market temperature, introduced by Dr.Alexander Elder, helps differentiate between sleepy, quiet and hot market periods.
Following is Mr.Elder's explanation on how to use this indicator (from his book "Come in to my Trading Room"):
"When markets are quiet, the adjacent bars tend to overlap. The consensus of value is well established, and the crowd does little buying or selling outside of yesterday’s range. When highs and lows exceed their previous day’s values, they do so only by small margins. Market Thermometer falls and its EMA slants down, indicating a sleepy market. When a market begins to run, either up or down, its daily bars start pushing outside of the previous ranges. The histogram of Market Thermometer grows taller and crosses above its EMA, which soon turns up, confirming the new trend."
"Market Thermometer gives four trading signals, based on the relationship between its histogram and its moving average:
1) The best time to enter new positions is when Market Thermometer falls below its moving average. When Market Thermometer falls below its EMA, it indicates that the market is quiet. If your system flashes an entry signal, try to enter when the market is cooler than usual. When Market Thermometer rises above its moving average, it warns that the market is hot and slippage more likely.
2) Exit positions when Market Thermometer rises to triple the height of its moving average. A spike of Market Thermometer indicates a runaway move. When the crowd feels jarred by a sudden piece of news and surges, it is a good time to take profits. Panics tend to be short-lived, offering a brief opportunity to cash in. If the EMA of Market Thermometer stands at 5 cents, but the Thermometer itself shoots up to 15 cents, take profits. Test these values for the market you are trading.
3) Get ready for an explosive move if the Thermometer stays below its moving average for five to seven trading days. Quiet markets put amateurs to sleep. They become careless and stop watching prices. Volatility and volume fall, and professionals get a chance to run away with the market. Explosive moves often erupt from periods of inactivity.
4) Market Thermometer can help you set a profit target for the next trading day. If you are a short-term trader and are long, add the value of today’s Thermometer EMA to yesterday’s high and place a sell order there. If you are short, subtract the value of the Thermometer’s EMA from yesterday’s low and place an order to cover at that level."
You can configure the "Explosive Move threshold" (default: 3), "Idle Market Threshold" (default: 7) and "Thermometer EMA length" (default: 22) via Options page.
More info:
"Come in to my Trading Room - A complete Guide to Trading" by Dr.Alexander Elder. (Page 162)
List of my other indicators:
- Chart:
- GDoc: docs.google.com

Price Action Ultimate LITE v2
PRICE ACTION ULTIMATE LITE v2
Structure First. Risk Defined. Results Measured.
Most traders don’t fail because they can’t find entries.
They fail because risk is unclear, reward is emotional, and results are never measured.
Price Action Ultimate LITE v2 was built to solve exactly this problem.
This is not a signal spam tool.
This is a price action framework that helps you understand when a trade makes sense, how much you risk, and whether your decisions are actually working over time.
🧠 CORE IDEA — PRICE ACTION ONLY
Price Action Ultimate LITE is built on pure price action logic.
No indicators fighting each other.
No clutter.
No emotional entries.
Every trade begins with structure.
When a valid Order Block forms and price reacts:
Market structure is confirmed
A trade scenario becomes valid
Risk and reward are calculated automatically
This is not prediction.
This is reaction to price.
🎯 AUTOMATIC RISK / REWARD BOXES
(The heart of the system)
Once an entry is triggered:
A Risk / Reward box is created automatically
Entry, Stop, and Target are clearly defined
The user controls the R:R ratio in advance
This changes everything.
Instead of asking
“Should I take this trade?”
you ask
“Is this risk worth the reward?”
You can:
Test different R:R values
Compare outcomes
Build your own trade model
📊 TRADE MANAGER — DATA, NOT OPINIONS
Every trade is tracked and measured.
The Trade Manager shows:
Floating PnL
Risk-based profit & loss
Last 10 / 25 / 50 / 100 trades performance
Trade reason & duration
Total trade count
This allows you to validate your settings with real data.
No guessing.
No assumptions.
🔵 ENTRY MARKERS & REPLAY MODE
(Learn from the past)
Each historical trade is marked on the chart:
Green circles → Long entries
Red circles → Short entries
Fully compatible with TradingView Replay Mode.
You can rewind, replay, and study:
Structure
Timing
R:R behavior
⚠️ Pro Tip:
If you disable Auto-Remove Broken Blocks, entry markers become even clearer for educational review.
🔔 SMART ALERT SYSTEM
(Designed for real traders)
Price Action Ultimate LITE includes a practical alert system:
Entry alerts (bar close)
Stop Loss alerts (instant)
Take Profit alerts (instant)
Timeout alerts
Optional PnL alerts
Alerts help you act on structure —
not chase price.
🌈 MA RIBBON — TREND CONTEXT (LITE)
The MA Ribbon provides:
Trend direction context
Visual candle coloring
Clean market bias awareness
⚠️ In LITE , the ribbon is intentionally visual and simplified.
👉 The PRO version expands this concept significantly with:
Advanced logic layers
Stronger filtering
More customization
(No action required — just awareness.)
🆓 FREE TO USE — PROTECTED SOURCE
✔ Free for everyone
✔ Protected code
✔ No limitations
You get a complete, usable system — not a crippled demo.
WHO THIS IS FOR
✔ Traders who value risk management
✔ Price action traders
✔ Traders who want structure + data
✔ Those who improve through review & statistics
WHO THIS IS NOT FOR
✖ Shortcut seekers
✖ “Holy grail” hunters
✖ Repainting signal fans
✖ Traders ignoring risk
User Advantages
For Beginners:
Learn price action concepts through visual examples
Understand institutional order flow without complex theory
Develop disciplined risk management habits
Build confidence with systematic, rule-based entries
For Experienced Traders:
Save hours on manual market structure analysis
Backtest different R:R ratios and risk amounts
Fine-tune parameters to match your trading style
Use as a confirmation tool for existing strategies
For All Traders:
Never Miss Entries: Alerts ensure timely execution
Objective Decisions: Remove emotion with clear rules
Continuous Improvement: Analyze past performance to refine settings
Flexible Adaptation: Works across all timeframes and instruments
Pro Version Preview
Note: The LITE version provides robust functionality with some limitations. The upcoming PRO version will feature:
Advanced Ribbon Settings: More MA types, adaptive periods, and multi-timeframe analysis
Enhanced Block Detection: Additional block types and confluence scoring
Advanced Statistics: Win rate by block type, time-of-day analysis, and correlation metrics
Custom Script Integration: Ability to add personal confirmation filters
Multi-instrument Analysis: Portfolio-level insights and correlations
Priority Support & Updates: Direct access to development team
Getting Started
Add indicator to your chart
Adjust theme to match your preference (Dark/Light/Custom)
Set your desired R:R ratio and risk amount
Enable alerts for your preferred notification
Review historical signals to understand system behavior
Start trading with clear visual guidance
Philosophy
"Price is the ultimate truth" – This indicator respects that philosophy by focusing exclusively on price action, without lagging indicators or predictive algorithms. It helps you see what institutions see: order flow, market structure, and high-probability supply/demand zones.
Price Action Ultimate LITE brings professional price action analysis to every trader. Whether you're learning market structure or seeking a systematic approach to order flow trading, this indicator provides the visual framework and risk management tools for more disciplined trading decisions.
The PRO version (coming soon) will expand these capabilities significantly, offering institutional-grade tools for serious traders seeking maximum advantage in the markets.
FINAL WORD
Price Action Ultimate LITE does not promise profits.
It gives you something far more valuable:
Clarity. Structure. Accountability.
If you respect risk,
if you study your trades,
and if you let data guide you —
this tool will grow with you.

SMMA Breakout ATR retest systemA fast, ATR-based SMMA breakout scalping system designed for Gold (XAUUSD). It can also be used on other Forex and Indices pairs. Uses breakout-retest confirmation, no-chase protection, and clean visual risk levels. Optimized for quick TP1 scalps with controlled drawdowns.
Quick Scalp TP1 — Checklist
🔧 Setup
☐ Symbol: XAUUSD
☐ Timeframe: 5m
☐ SMMA Length: 5
☐ ATR Length: 14
⚙️ Settings
☐ Stop Loss: 1.5× ATR
☐ Take Profit: ATR 1.2× (TP1 only)
☐ Show Entry/SL?TP Lines & Labels✅ ON
☐ Show Entry Arrows✅ ON
☐ Show Early Warning Labels on Chart✅ ON
☐ ATR Range Filter: ❌ OFF
☐ HTF Bias (15m / 1H): ❌OFF
☐ 15m Candle Body Filter: ❌ OFF
☐ NY Session Filter: ❌ OFF
☐ Retest Entry: ✅ ON
☐ No-Chase Filter: ✅ ON
📈 BUY and SELL Entry Rules :
✅ Long setup (BUY)
If Retest Entry is ON:
☐ 1. Price breaks above the 5-SMMA (raw breakout begins)
☐ 2. Price pulls back and retests near/into the SMMA
☐ 3. A confirmation candle closes back up and breaks the retest high
➡️ BUY arrow prints + risk panel switches to SIDE: LONG
If Retest Entry is OFF:
• The BUY arrow prints immediately when the price crosses above the 5-SMMA (if filters pass)
✅ Short setup (SELL)
Same idea, reversed:
☐ 1. Break below SMMA
☐ 2. Retest near/into SMMA
☐ 3. Confirmation closes down, and breaks retest low
➡️ SELL arrow prints + panel shows SIDE: SHORT
🎯 Trade Management
When a confirmed entry happens, the script prints/plot lines to show clearly:
• ENTRY
• SL (ATR-based)
• TP1
☐ Do not hold runners in this mode, take full profit at TP1
🔔 Alerts (Recommended) - Tradingview Essential Package will allow you to use alerts
Create these alerts:
Confirmed Entry Alerts
• GG BUY CONFIRMED
• GG SELL CONFIRMED
• Set to: ✅ Once per bar close
•Type in Alert Name and Message - SELL CONFIRMED or BUY CONFIRMED
• Enable: Popup + Sound
Early Warning Alerts (Optional)
• GG EARLY BUY WARNING
• GG EARLY SELL WARNING
• Set to: ✅ Once per bar
•Type in Alert Name and Message - Potential Buy forming of Potential Sell forming
• Used only as a heads-up, not an entry
⚠️ Important Notes / Disclaimer
This script is a technical analysis tool, not financial advice.
All trading involves risk. Always test settings on a demo before live use.
Results will vary depending on market conditions, broker execution, and risk settings.

VR Volume Ratio + Divergence (Pro)成交量比率 (Volume Ratio, VR) 是一項通過分析股價上漲與下跌日的成交量,來研判市場資金氣氛的技術指標。本腳本基於傳統 VR 公式進行了優化,增加了**「趨勢變色」與「自動背離偵測」**功能,幫助交易者更精準地捕捉量價轉折點。
Introduction
Volume Ratio (VR) is a technical indicator that measures the strength of a trend by comparing the volume on up-days versus down-days. This script enhances the classic VR formula with "Trend Color Coding" and "Auto-Divergence Detection", helping traders identify volume-price reversals more accurately.
核心功能與參數
公式原理: VR = (Qu + Qf/2) / (Qd + Qf/2) * 100
Qu: 上漲日成交量 (Up volume)
Qd: 下跌日成交量 (Down volume)
Qf: 平盤日成交量 (Flat volume)
參數 (Length):預設為 26 日,這是市場公認最有效的短中線參數。
關鍵水位線 (Key Levels):
< 40% (底部區):量縮極致,市場情緒冰點,常對應股價底部,適合尋找買點。
100% (中軸):多空分界線。
> 260% (多頭警戒):進入強勢多頭行情,但需注意過熱。
> 450% (頭部區):成交量過大,市場情緒亢奮,通常為頭部訊號。
視覺優化 (Visuals):
紅漲綠跌:當 VR 數值大於前一日顯示為紅色(動能增強);小於前一日顯示為綠色(動能退潮)。
背離訊號 (Divergence):自動標記量價背離。
▲ 底背離 (Bullish):股價創新低,但 VR 指標墊高(主力吸籌)。
▼ 頂背離 (Bearish):股價創新高,但 VR 指標走弱(買氣衰竭)。
Features & Settings
Formula Logic: Calculated as VR = (Qu + Qf/2) / (Qd + Qf/2) * 100.
Default Length: 26, widely regarded as the optimal setting for short-to-medium term analysis.
Key Zones:
< 40% (Oversold/Bottom): Extreme low volume, often indicating a market bottom and potential buying opportunity.
100% (Neutral): The balance point between bulls and bears.
> 260% (Bullish Zone): Strong uptrend, volume is expanding.
> 450% (Overbought/Top): Extreme high volume, often indicating a market top and potential reversal.
Visual Enhancements:
Color Coding: Line turns Red when VR rises (Momentum Up) and Green when VR falls (Momentum Down).
Divergence Signals: Automatically marks divergence points on the chart.
▲ Bullish Divergence: Price makes a lower low, but VR makes a higher low (Accumulation).
▼ Bearish Divergence: Price makes a higher high, but VR makes a lower high (Distribution).
應用策略建議
抄底策略:當 VR 跌破 40% 後,指標線由綠翻紅,或出現「▲底背離」訊號時,為極佳的波段進場點。
逃頂策略:當 VR 衝過 450% 進入高檔區,一旦指標線由紅翻綠,或出現「▼頂背離」訊號時,建議分批獲利了結。
Strategy Guide
Bottom Fishing: Look for entries when VR drops below 40% and turns red, or when a "▲ Bullish Divergence" label appears.
Taking Profit: Consider selling when VR exceeds 450% and turns green, or when a "▼ Bearish Divergence" label appears.
Disclaimer: This tool is for informational purposes only and does not constitute financial advice. / 本腳本僅供參考,不構成投資建議。

Liquidity Sentiment Profile | LUPENIndicator Guide: Liquidity Sentiment Profile (LSP).
What is the LSP?
The Liquidity Sentiment Profile (LSP) is a "Next-Generation" oscillator designed to look beyond simple price action. While standard indicators (like RSI or MACD) primarily focus on where a candle closes, the LSP analyzes the micro-structure of the entire candle—specifically the relationship between the candle's Body, its Wicks (Shadows), and the Volume.
The Core Philosophy:
Wicks tell the truth: A long lower wick indicates that sellers pushed the price down, but buyers aggressively absorbed that liquidity and pushed it back up.
That is hidden bullish strength.
Volume validates intent: A price move with low volume is noise. A price move (or wick rejection) with high volume is a commitment by institutional players.
The LSP calculates a "Sentiment Score" between -100 and +100 based on these factors.
How to Read the Visuals
The Colors (Intensity)
color: Light Green - Bullish Acceleration. Buyers are in control, and momentum is increasing. This is the ideal time to be in a Long trade.
color: Dark Green - Bullish Deceleration. Buyers are still in control (price is likely rising), but the momentum is fading. This is a warning sign to tighten stop-losses or take profits.
color: Light Red - Bearish Acceleration. Sellers are dominating, and panic is increasing. This is the ideal time to be Short.
color: Dark Red - Bearish Deceleration. Sellers are still in control, but the downward pressure is exhausted. Be careful with new short positions.
The Lines & Fills
The Main Line: The actual LSP sentiment value.
The Yellow Signal Line: A smoothed average of the sentiment.
The Core Fill: The colored area between the Main Line and the Signal Line. When this area "glows", the trend is strong. When it dims (Dark), the trend is weak. Bearish Deceleration. Sellers are still in control, but the downward pressure is exhausted. Be careful with new short positions.
The Lines & Fills
The Main Line: The actual LSP sentiment value.
The Yellow Signal Line: A smoothed average of the sentiment.
The Core Fill: The colored area between the Main Line and the Signal Line. When this area "glows" (Neon), the trend is strong. When it dims (Dark), the trend is weak.
How to Use It (Trading Strategies)
Strategy A: The "Power Cross" (Trend Entry)
Use this for entering trends when the market wakes up.
Long Entry: Wait for the LSP line to cross ABOVE the Yellow Signal Line.
Confirmation: The fill color must turn Neon Green.
Short Entry: Wait for the LSP line to cross BELOW the Yellow Signal Line.
Confirmation: The fill color must turn Neon Red.
Strategy B: The "Absorption" Play (Reversals)
This is where the LSP shines. It detects when liquidity is being absorbed before price turns.
Bullish Absorption: The Price makes a Lower Low, but the LSP makes a Higher Low. This happens because the LSP detects the Volume on the Lower Wicks (buyers absorbing selling pressure). This is a high-probability reversal signal.
Bearish Absorption: The Price makes a Higher High, but the LSP makes a Lower High. The volume on the Upper Wicks suggests sellers are absorbing the buy orders.
Strategy C: The "Dimming" Exit (Risk Management)
Don't wait for the price to crash to exit a trade.
If you are in a Long trade (Neon Green) and the color instantly shifts to Dark Green, it means the "fuel" is running out. Consider taking partial profits or moving your Stop Loss to break even.
Standard oscillators (like RSI) often give false signals during strong trends (showing "Overbought" while price keeps going up). The LSP avoids this because it weights Volume and Wicks. If price goes up and volume increases, the LSP stays Neon Green, telling you the move is genuine, not just overextended.

MACD Nexus Pro [OXE]MACD Nexus Pro
Institutional-Grade Momentum Intelligence System
Transform How You Read Market Momentum
Standard MACD indicators show you what happened. MACD Nexus Pro shows you what's about to happen.
Built for serious traders who demand more than basic crossovers, this indicator combines 8 proprietary analysis engines into one powerful momentum intelligence system. Whether you trade forex, crypto, stocks, or commodities — MACD Nexus Pro gives you the institutional edge.
What Makes This Different?
Most MACD indicators are stuck in the 1970s. They show you two lines, a histogram, and leave you guessing. MACD Nexus Pro was engineered from the ground up to answer the questions professional traders actually ask:
"Is this signal confirmed across multiple timeframes?"
"Is this momentum move real or a fake-out?"
"Are smart money players accumulating or distributing?"
"Is this trend exhausted or just getting started?"
Core Benefits for Traders
🎯 Eliminate False Signals with MTF Confluence
Stop getting chopped up by single-timeframe noise. The Multi-Timeframe Confluence Matrix scans 4 timeframes simultaneously and calculates a unified alignment score from -5 to +5.
How it helps you:
Only take trades when multiple timeframes agree
See instantly if higher timeframes support your entry
Avoid counter-trend trades that fail 80% of the time
Build confidence knowing the "big picture" backs your trade
📊 Know Your Market Regime Instantly
Markets behave differently in trending vs ranging conditions. The Regime Detection Engine automatically classifies current conditions as TRENDING, VOLATILE, RANGING, or NEUTRAL.
How it helps you:
Adjust your strategy to match market conditions
Avoid momentum trades in choppy, ranging markets
Capitalize on trending markets with confidence
Stop forcing trades when conditions don't favor your style
🔄 Catch Reversals Early with Smart Divergence Detection
Divergences signal potential reversals before they happen — but spotting them manually is tedious and error-prone. The Divergence Engine automatically detects both Regular and Hidden divergences, then rates their strength.
How it helps you:
Get early warning of trend exhaustion
Find high-probability reversal entries
Use Hidden divergences for trend continuation trades
Prioritize strong divergences (★★★★) over weak ones
🏦 Trade Alongside Smart Money
Institutional players leave footprints. The Smart Money Momentum Zones detect when volume-weighted momentum enters extreme territory — signaling potential accumulation (buying) or distribution (selling) by large players.
How it helps you:
Identify where institutions are likely positioning
Buy in accumulation zones with smart money
Sell or short in distribution zones
Avoid buying into institutional selling
⚡ Distinguish Impulse Moves from Corrections
Not all momentum is created equal. The Impulse Wave Detection system identifies whether current momentum is an impulse (strong, directional) or a correction (weak, counter-trend).
How it helps you:
Enter on impulses, not corrections
Hold winners through corrections without panic
Recognize when a trend is resuming
Time entries at the start of new momentum waves
📍 Never Miss True Equilibrium
Static zero lines are outdated. The Dynamic Zero Line adapts to the market's true momentum equilibrium, shifting based on long-term bias.
How it helps you:
Understand the market's real neutral point
Recognize bullish/bearish bias at a glance
Better time zero-line crossover trades
Filter signals based on positioning above/below equilibrium
⚠️ Get Warned Before Momentum Dies
Chasing extended moves is how traders lose money. The Momentum Exhaustion Detector calculates the thrust-to-follow-through ratio and warns you when momentum is overextended.
How it helps you:
Avoid late entries into tired trends
Take profits before reversals hit
Spot when bulls/bears are running out of steam
Stay patient for better entries after exhaustion
🌈 Read Momentum Strength at a Glance
The Gradient Histogram Heatmap shows momentum acceleration through color intensity — brighter colors mean momentum is building, faded colors mean it's dying.
How it helps you:
Instantly see if momentum is accelerating or fading
Confirm breakouts with strengthening momentum
Spot weakening moves before price confirms
Make faster decisions with visual clarity
The Signal System You Can Trust
Every buy/sell signal comes with a Star Rating (★ to ★★★★★) based on:
Multi-timeframe alignment
Position relative to dynamic zero
Market regime confirmation
Volume confirmation
Exhaustion status
Choose your signal mode:
Standard: Classic MACD crossovers
Confluence: Only signals with MTF agreement (recommended)
Aggressive: Early entries with directional confluence
All signals are 100% non-repainting — what you see is what happened, permanently.
Two Professional Dashboards
MTF Confluence Panel (Top-Right)
TimeframeTrendAbove ZeroCurrent▲/▼✓/✗15min▲/▼✓/✗1H▲/▼✓/✗4H▲/▼✓/✗Daily▲/▼✓/✗
Nexus Status Panel (Bottom-Right)
Regime: TRENDING / VOLATILE / RANGING / NEUTRAL
Confluence: Net score (-5 to +5)
Zone: ACCUMULATION / DISTRIBUTION / NEUTRAL
Momentum: IMPULSE / CORRECTION / NORMAL
Exhaustion: BULL TIRED / BEAR TIRED / OK
Built-In Alerts
Never miss a trade. Set alerts for:
✅ Buy/Sell signals
✅ High-confluence signals (4+ stars)
✅ Momentum exhaustion warnings
✅ Impulse wave starts
✅ Zero line crosses
✅ Bullish/Bearish divergences
Who Is This For?
✓ Day Traders — Filter noise with MTF confluence, catch impulse moves early
✓ Swing Traders — Ride trends confidently with regime detection and exhaustion warnings
✓ Scalpers — Use aggressive mode with volume-confirmed signals
✓ Position Traders — Align with smart money accumulation/distribution zones
✓ Crypto Traders — Essential for volatile markets where exhaustion detection saves accounts
✓ Forex Traders — Multi-session momentum tracking across timeframes
What Traders Are Saying
"Finally, a MACD that tells me more than just 'line crossed line.' The exhaustion warnings alone have saved me from so many bad trades."
"The MTF confluence is a game-changer. I only trade 4+ star setups now and my win rate has never been better."
"I love how the regime detection stops me from forcing momentum trades in ranging markets. Should have had this years ago."
Summary: Your Edge in 8 Features
FeatureWhat It DoesYour BenefitMTF ConfluenceScans 4 timeframesHigher probability entriesRegime DetectionClassifies market conditionsRight strategy, right timeDivergence EngineFinds reversal signalsCatch turns earlySmart Money ZonesDetects institutional activityTrade with the big playersImpulse DetectionIdentifies momentum qualityEnter on strength, not weaknessDynamic Zero LineAdapts to market biasTrue equilibrium referenceExhaustion DetectorWarns of tired momentumAvoid late, losing tradesGradient HistogramShows acceleration visuallyInstant momentum read
Settings Overview
Fully customizable for any trading style:
MACD lengths (Fast/Slow/Signal)
4 MTF timeframes
Divergence sensitivity
Regime detection parameters
Signal mode selection
Minimum confluence threshold
Zone thresholds
Visual colors and toggles
Risk Disclaimer
No indicator guarantees profits. MACD Nexus Pro is a decision-support tool designed to improve your analysis — not replace sound risk management. Always use stop losses and never risk more than you can afford to lose.
Upgrade Your Momentum Analysis Today
Stop guessing. Start trading with institutional-grade momentum intelligence.
MACD Nexus Pro — See Momentum Differently.

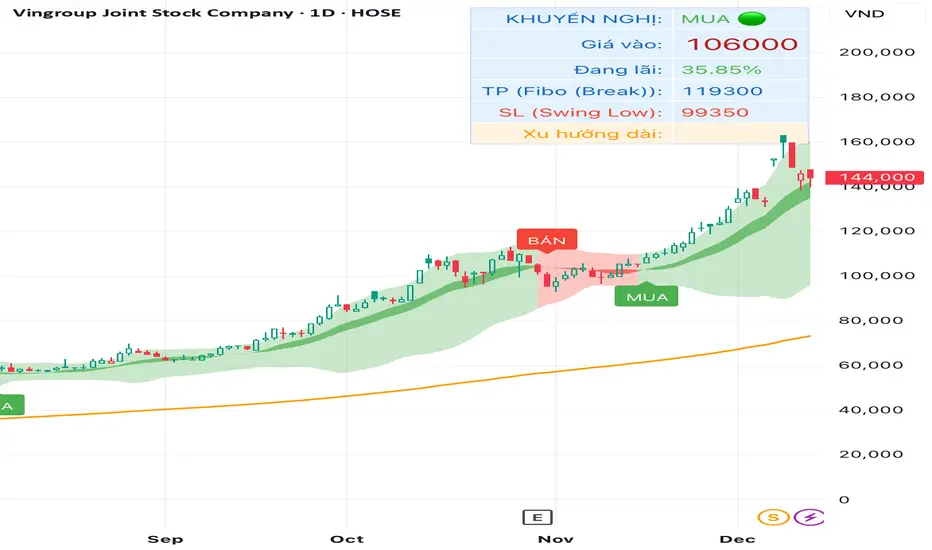
TRAING.COM.VN V66TRAING.COM.VN V66 – Professional Trend Following System
TRAING.COM.VN V66 is an advanced trend-following toolkit designed to capture major market moves with institutional-grade precision, optimized for both Swing and Position trading.
KEY FEATURES:
Trend Lock Technology: Utilizes HLC3 & Pivot Breakout logic to "lock" the trend color, eliminating noise and fake signals during consolidation.
Smart Target Engine: Automatically scans multi-timeframe data to determine the best Take Profit level:
Safe Mode: Targets strong Daily Resistance levels.
ATH Mode: Switches to Fibonacci Extension when price breaks All-Time Highs to maximize profits.
Pro Risk Management: Features an automatic Swing Low Stoploss (5-candle lookback) and an integrated Trailing Stop to secure gains as price rallies.
Macro Trend Filter: Built-in EMA 200 warning system to prevent trading against the long-term trend.
Clean Chart Mode: Option to display only the Last Active Signal, keeping your chart clutter-free for focused execution.

TRADING.COM.VN Pro V66TRADING.COM.VN – Professional Trend Following System
TRADING.COM.VN is an advanced trend-following toolkit designed to capture major market moves with institutional-grade precision, optimized for both Swing and Position trading.
KEY FEATURES:
Trend Lock Technology: Utilizes HLC3 & Pivot Breakout logic to "lock" the trend color, eliminating noise and fake signals during consolidation.
Smart Target Engine: Automatically scans multi-timeframe data to determine the best Take Profit level:
Safe Mode: Targets strong Daily Resistance levels.
ATH Mode: Switches to Fibonacci Extension when price breaks All-Time Highs to maximize profits.
Pro Risk Management: Features an automatic Swing Low Stoploss (5-candle lookback) and an integrated Trailing Stop to secure gains as price rallies.
Macro Trend Filter: Built-in EMA 200 warning system to prevent trading against the long-term trend.
Clean Chart Mode: Option to display only the Last Active Signal, keeping your chart clutter-free for focused execution.

TRADING.COM.VN Pro V43 (Pivot & Smart Target D)TRADING.COM.VN – Professional Trend Following System
TRADING.COM.VN is an advanced trend-following toolkit designed to capture major market moves with institutional-grade precision, optimized for both Swing and Position trading.
KEY FEATURES:
Trend Lock Technology: Utilizes HLC3 & Pivot Breakout logic to "lock" the trend color, eliminating noise and fake signals during consolidation.
Smart Target Engine: Automatically scans multi-timeframe data to determine the best Take Profit level:
Safe Mode: Targets strong Daily Resistance levels.
ATH Mode: Switches to Fibonacci Extension when price breaks All-Time Highs to maximize profits.
Pro Risk Management: Features an automatic Swing Low Stoploss (5-candle lookback) and an integrated Trailing Stop to secure gains as price rallies.
Macro Trend Filter: Built-in EMA 200 warning system to prevent trading against the long-term trend.
Clean Chart Mode: Option to display only the Last Active Signal, keeping your chart clutter-free for focused execution.